RIPE TTM Boxes
Summary
The Test Traffic Measurements service has been offered by the RIPE NCC as a service since the year 2000. The system continuously records one-way delay_andpacket-loss_ measurements as well as router-level paths ("traceroutes") between a large set of probe machines ("test boxes"). The test boxes are hosted by many different organisations, including NRENs, commercial ISPs, universities and others, and usually maintained by RIPE NCC as part of the service. While the vast majority of the test boxes is in Europe, there are a couple of machines in other continents, including outside the RIPE NCC's service area. Every test box includes a precise time source - typically a GPS receiver - so that accurate one-way delay measurements can be provided. Measurement data are entered in a central database at RIPE NCC's premises every night. The database is based on CERN's ROOT system. Measurement results can be retrieved over the Web using various presentations, both pre-generated and "on-demand".
Applicability
RIPE TTM data is often useful to find out "historical" quality information about a network path of interest, provided that TTM test boxes are deployed near (in the topological sense, not just geographically) the ends of the path. For research network paths throughout Europe, the coverage of the RIPE TTM infrastructure is not complete, but quite comprehensive. When one suspects that there is (non-temporary) congestion on a path covered by the RIPE TTM measurement infrastructure, the TTM graphs can be used to easily verify that, because such congestion will show up as delay and/or loss if present.
The RIPE TTM system can also be used by operators to precisely measure - but only after the fact - the impact of changes in the network. These changes can include disturbances such as network failures or misconfigurations, but also things such as link upgrades or routing improvements.
Notes
The TTM project has provided extremely high-quality and stable delay and loss measurements for a large set of network paths (IPv4 and recently also IPv6) throughout Europe. These paths cover an interesting mix of research and commercial networks. The Web interface to the collected measurements supports in-depth exploration quite well, such as looking at the delay/loss evolution of a specific path over both a wide range of intervals from the very short to the very long. On the other hand, it is hard to get at useful "overview" pictures. The RIPE NCC's DNS Server Monitoring (DNSMON) service provides such overviews for specific sets of locations.
The raw data collected by the RIPE TTM infrastructure is not generally available, in part because of restrictions on data disclosure. This is understandable in that RIPE NCC's main member/customer base consists of commercial ISPs, who presumably wouldn't allow full disclosure for competitive reasons. But it also means that in practice, only the RIPE NCC can develop new tools that make use of these data, and their resources for doing so are limited, in part due to lack of support from their ISP membership. On a positive note, the RIPE NCC has, on several occasions, given scientists access to the measurement infrastructure for research. The TTM team also offers to extract raw data (in ROOT format) from the TTM database manually on demand.
Another drawback of RIPE TTM is that the central TTM database is only updated once a day. This makes the system impossible to use for near-real-time diagnostic purposes. (For test box hosts, it is possible to access the data collected by one's hosted test boxes in near realy time, but this provides only very limited functionality, because only information about "inbound" packets is available locally, and therefore one can neither correlate delays with path changes, nor can one compute loss figures without access to the sending host's data.) In contrast, RIPE NCC's Routing Information Service (RIS) infrastructure provides several ways to get at the collected data almost as it is collected. And because RIS' raw data is openly available in a well-defined and relatively easy-to-use format, it is possible for third parties to develop innovative and useful ways to look at that data.
Examples
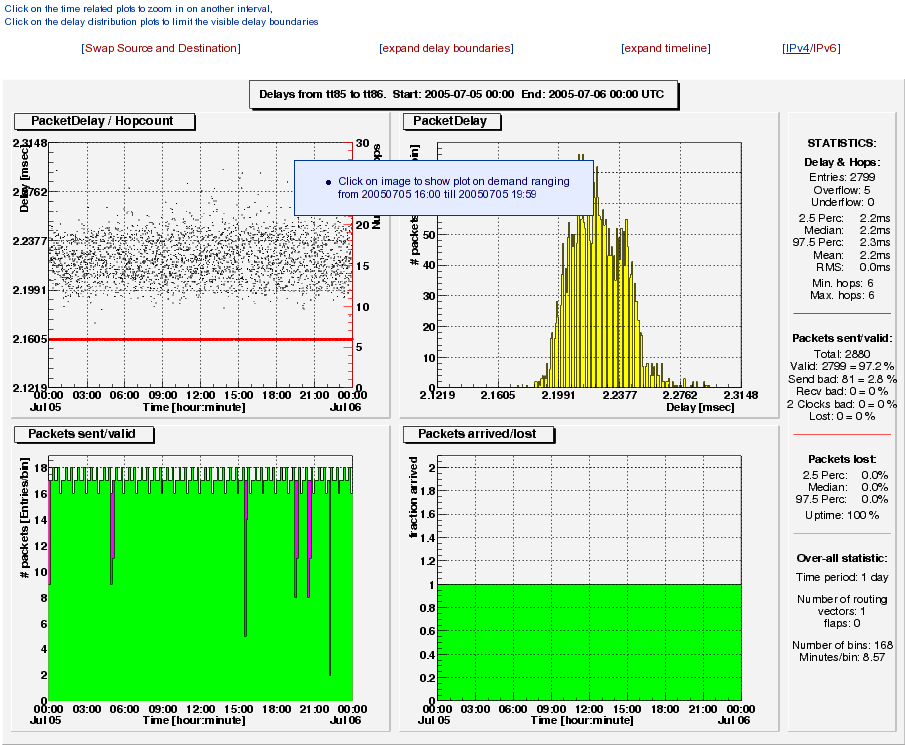
The following screenshot shows an on-demand graph of the delays over a 24-hour period from one test box hosted by SWITCH ( tt85 at ETH Zurich) to to other one ( tt86 at the University of Geneva). The delay range has been narrowed so that the fine-grained distribution can be seen. Five packets are listed as "overflow" under "STATISTICS - Delay & Hops" because their one-way delays exceeded the range of the graph. This is an example of an almost completely uncongested path, showing no packet loss and the vast majority of delays very close to the "baseline" value.
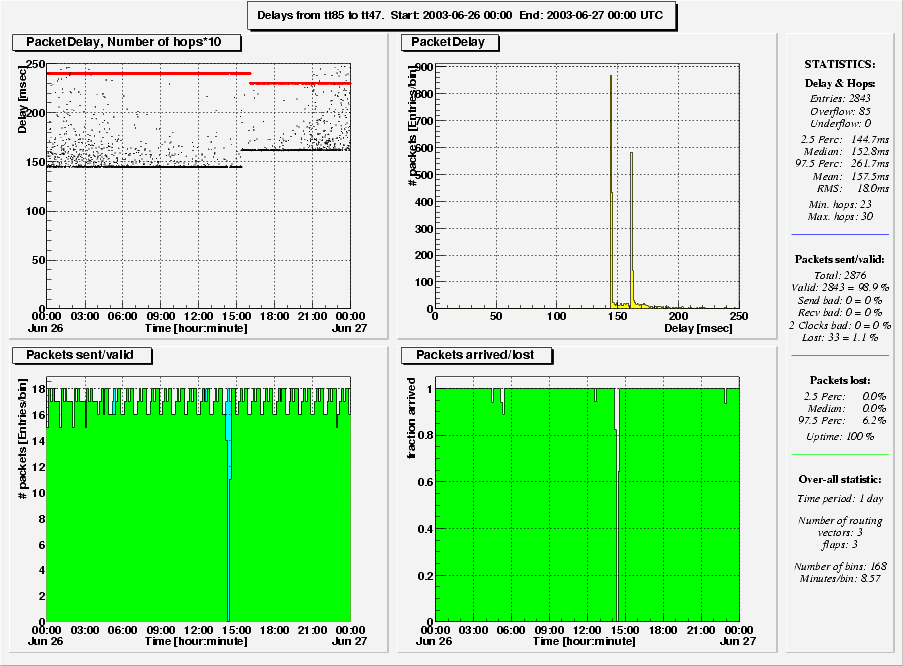
The following plot shows the impact of a routing change on a path to a test box in New Zealand (=tt47=). The hop count decreases by one, but the base one-way delay increased by about 20ms. The old and new routes can be retrieved from the Web interface too. Note also that the delay values are spread out over a fairly large range, which indicates that there is some congestion (and thus queueing) on the path. The loss rate over the entire day is 1.1%. It is somewhat interesting how much of this is due to the routing change and how much (if any) is due to "normal" congestion. The lower right graph shows "arrived/lost" packets over time and indicates that most packets were in fact lost during the path change - so although some congestion is visible in the delays, it is not severe enough to cause visible loss. On the other hand, the total number of probe packets sent (about 2850 per day) means that congestion loss would probably go unnoticed until it reaches a level of 0.1% or so.
References
- RIPE Test Traffic Measurements, Web site, http://www.ttm.ripe.net/
-- Main.FrancoisXavierAndreu & Main.SimonLeinen - 06 Jun 2005 - 06 Jul 2005
Q%on demand%Q% example" date="1120667347" path="ripe-ttm-sample-delay-on-demand.png" size="86137" user="SimonLeinen" version="1.1"}%

